Why are Brisbane prices 'affordable'?
What is 724,000 in Sydney, 621,000 in Melbourne but only 466,000 in Brisbane? The number of cars driving through the CBD daily? The seconds of grey or rainy weather per year? Wrong!
It's the median residential property price in each of the three East Coast capitals.
Way more interesting than the prices themselves is the 'how affordable' aspect of housing.
This is when you start to get a truer picture of whether the current median prices are actually sustainable and 'affordable'.
There seems to be a distinct cycle of cities being at the forefront of housing price increases. One year it will be Sydney, another Melbourne, or Perth or Brisbane or Darwin. Unfortunately our southern friends in Adelaide and Hobart don't seem to have had their winning turn in this price game for quite some time now. Brisbane recorded 5.1% price growth in 2013, while Sydney lead the pack last year. As always, I advise to caution when looking at these figures as they represent the whole greater city region and includes houses and units. Growth may vary significantly across various suburbs or regions within a city, with houses vs units displaying further differences.
What influences housing price growth?
Population growth, economic growth and industry, as well as employment and construction are just some of the factors that influence how much a city's housing prices increase. I'm not going to go into all the various factors here, however one interesting statistic recently caught my eye...income!
Not just how much the average person earns, but the ratio of home prices to the average income. Basically, the lower the ratio the more 'affordable' a property is in terms of how many years of entire disposable income that is needed to pay for it.
This is where it gets interesting, as can be seen from the graph* below ...
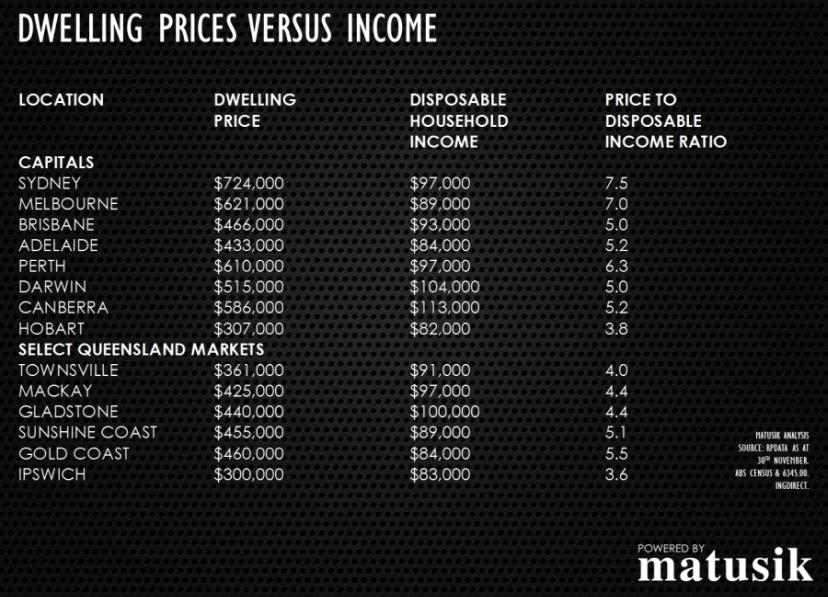
Brisbane prices are not only considerably lower than those in Sydney or Melbourne (or Perth or Canberra or Darwin) but they also have the 2nd lowest ratio of price to income. This means the houses are more 'affordable'.
But it's not just this perceived 'affordability', it also means there is definite room to move for Brisbane housing prices until they reach anywhere near the situation of the other main capitals.
In his article*, Matusik goes on to explain the impact of this on lending: how much could a person be expected to obtain for a housing loan? ...
"Assuming limited bad household debt (under $10,000 pa) & using a 5.25% variable interest rate over a 25 year owner-resident mortgage, all the markets outlined in the table (except Sydney & Melbourne) have some room to grow in terms of price during 2014. Even Perth.
"Using Brisbane as an example, the average Brisbane family household under these terms could afford to borrow up to $590,000 to buy a home. This is a big difference from the current $466,000 middle price.
In contrast, the typical Sydney family can only really afford $640,000, which is $80,000 less than Sydney's current median dwelling price of $724,000. Melbourne typical family can only afford a home priced in the high $500,000 price range. Melbourne's middle price now exceeds $620,000."
"In short, Brisbane has the capacity for some price growth. Whilst Sydney's (and Melbourne's) prices may continue to rise, there are serious limits now on affordability in both cities."
... and next week I'll be following up this theme with what various national property experts are forecasting for the Brisbane market in 2014 ...
* 'Brisbane – room to grow' article, Matusik Missive, Michael Matusik
(Source: Matusik Missive, Louise Moeller - HS Brisbane Property marketing)